
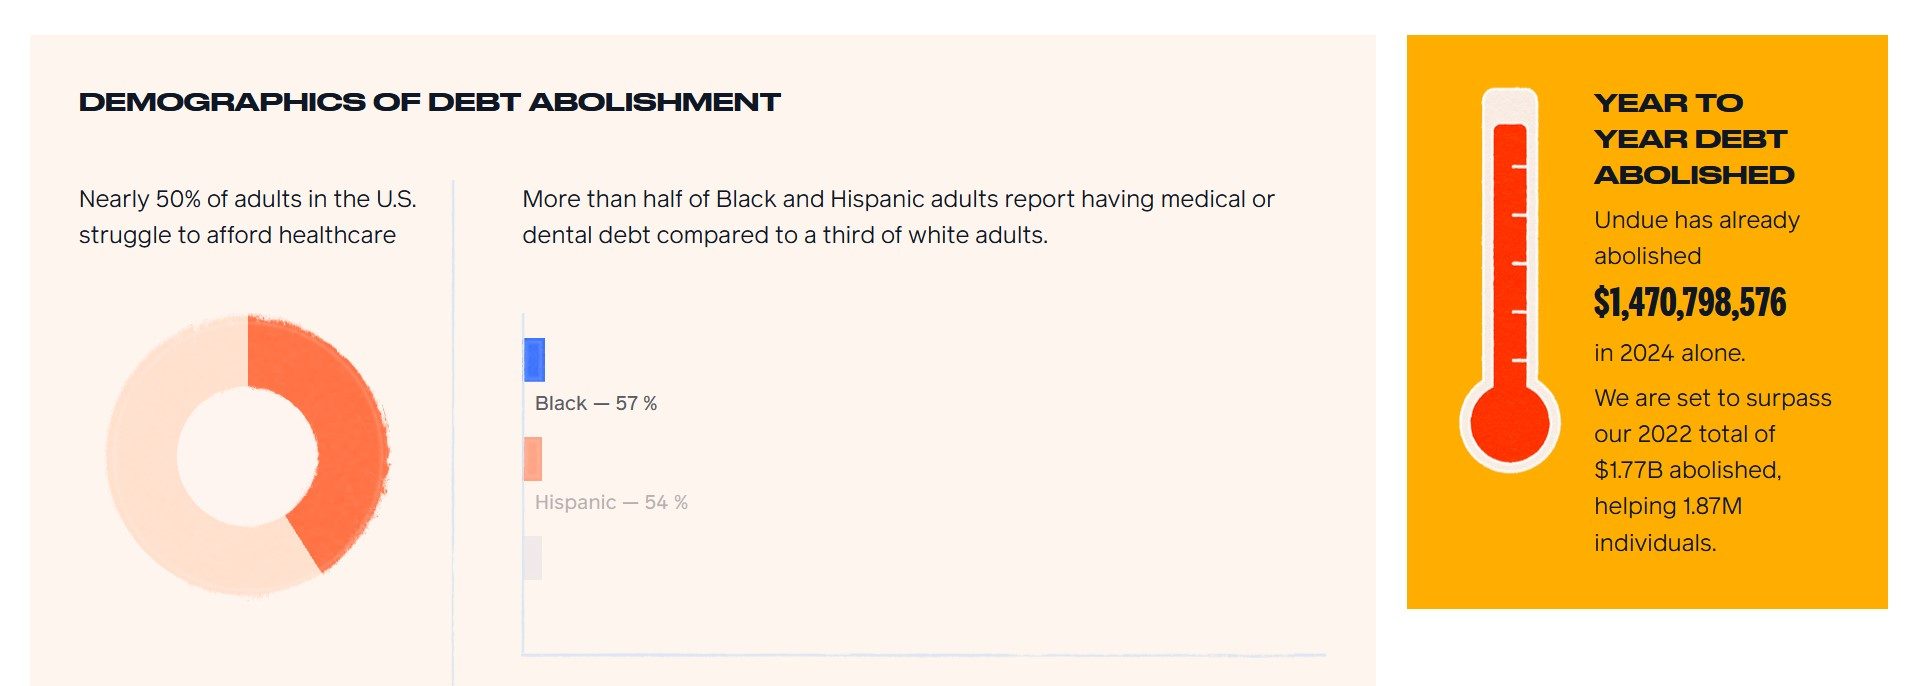
- Wherever possible, use statistics and graphics to illustrate BOTH sides of the issue: the problem you’re solving + how you’re solving it.
- Simple visuals go a long way toward making the problem + solution more scannable and understandable.
- When highlighting your impact, consider displaying a very a specific number to grab attention (like $1,470,798,576, as opposed to $1.4B).
Want more ideas like this, straight to your inbox?